Pensions in Crisis
It is difficult these days to pick up a newspaper or business magazine or to watch a national news broadcast without seeing a story about pensions. Most of these stories are tales of woe, highlighting the severe problems besetting the employer-based pension system in the United States. Many of these stories give the impression that the sponsors and managers of these plans are charlatans, idiots or both. Without a doubt, the U.S. pension system is facing major problems. But the most serious threat to the system may be a crisis in confidence, on the part of plan sponsors and workers.
The problems include underfunded plans, skyrocketing costs and perceived unfairness to workers as employers adapt their plans to today's economic realities. There are ongoing public debates about how to value and manage plan assets and liabilities, and how to determine benefits. Less well known are the complications of dealing with a myriad of pension rules within the context of troubled financial markets and the prospect of unprecedented labor market developments in years to come.
Deteriorating Funding Status of Private Pensions
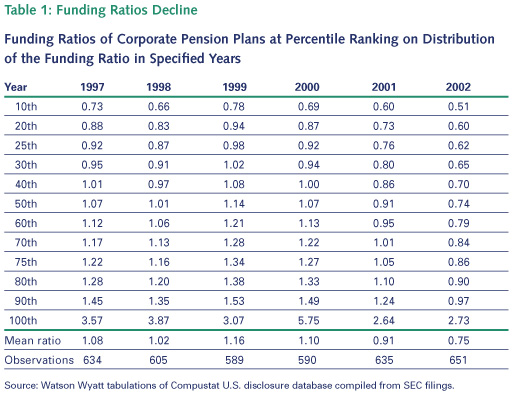
There is no disputing that pension plan funding is increasingly coming up short. Table 1 shows the funding status of pension plans sponsored by large publicly traded corporations in the United States from 1997 through 2002. The tabulation is based on the ratio of estimated pension assets to the estimated projected benefit obligation as reported by the top 1,000 firms by sales in the Compustat financial disclosure database. The rows represent the plans ranked in a percentile distribution on the basis of their pension funding ratios from 1997 to 2002. The cells report the funding ratio for the specified percentile in the distribution for the specified year. By the end of the 2002 fiscal year, the pension system was less well funded from top to bottom than at any other time during the period, with funding having deteriorated steadily from 1999 through 2002. The mean funded ratio fell from 1.16 in 1999 to 0.75 in 2002. In 1999, less than 30 percent of plans had a funding ratio below 1.00, but by 2002, that percentage had climbed to 90 percent.
Causes of Increased Underfunding
There are at least three forces at work that help to explain deteriorating pension funding. First, the discount rates used in valuing pension liabilities have declined, substantially increasing liabilities. The second factor has been the depressing effects of financial markets on pension asset values since early 2000. A third factor is the continuing aging of the workforce.
Discount Rates Decline and Drive up Liabilities
One wrinkle in understanding the story underlying Table 1 is the number of different discount rates used for valuing pension liabilities. Table 1 is based on financial reporting required by U.S. Securities and Exchange Commission (SEC) regulations. Different discount rates are used for pension funding in order for plan sponsors to comply with ERISA. And different rates again will likely be used to determine Pension Benefit Guaranty Corporation (PBGC) premiums and lump-sum payments for plan participants.
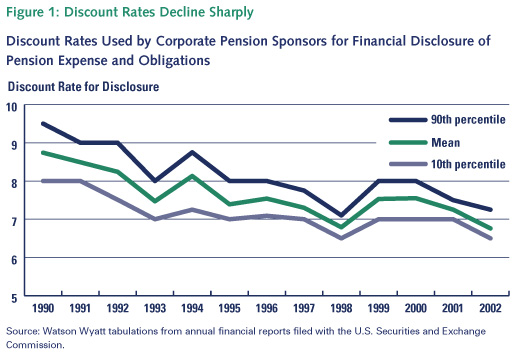
The average discount rates used in valuing projected benefit obligations in Table 1 are reflected by the green line in Figure 1 below. The light blue line below the green line is the assumption used by the sponsor at the 10th percentile from the bottom of a distribution of all plans. The dark blue line above the green line is the assumption used by the sponsor at the 90th percentile in that same distribution. There is a fairly clear downward trend over the period (albeit with some variation around the overall trend reflected in the figure). The lower the discount rate, the higher the liability. The implication is that the declining rates used for pension disclosure significantly increased pension costs over the past decade or so.
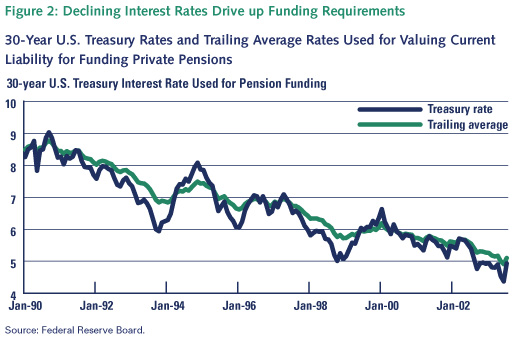
Pension funding requirements vary from the pension disclosure rules in terms of the interest rates used to discount future obligations. Funding obligations are calculated using a rate derived from the 30-year U.S. Treasury bond rate. The actual rate used for determining "current liability" is a 40/30/20/10 weighted average of the current rate and rates from the prior three years.1 In addition, there is a corridor of allowable rates from 90 to 105 percent of the weighted average that can be used for computation purposes. The blue line in Figure 2 shows the 30-year Treasury rates from January 1990 through July 2003. The green line shows the trailing weighted average of current and past rates that can be used to determine funding requirements.
In the latter part of the Clinton presidency, the federal government began to buy back federal debt, especially long-term debt. This continued during the early days of the Bush administration and, in early 2002, the government stopped issuing 30-year Treasury bonds. The combination of the federal government buying back its 30-year bonds and suspending the series contributed to declining returns on these bonds, as their increasing scarcity drove their prices higher relative to other low-risk, long-term bonds. This development convinced many people that using the 30-year Treasury rate to value pension liabilities overestimates true liabilities. Because of concerns about potential pension funding requirements hurting the economy, policymakers increased the upper side of the interest rate corridor from 105 to 120 percent of the trailing average rate for 2002 and 2003. Despite these efforts, declining interest rates have been driving up funding requirements.
The differences in the rates in Figures 1 and 2 are significant. One reason is that the government and the SEC look at pension plan liabilities from different perspectives. The government assumes a relatively conservative perspective, because underfunded plans may be forced to terminate and to purchase annuities to cover participants, or, if the sponsor is in dire financial straits, the plan might be turned over to the PBGC. Government bond rates are a relatively conservative measure of obligations. The SEC, on the other hand, is concerned about reasonable disclosure of ongoing plan operations. So it''''s reasonable for the SEC to consider that obligations will be covered by assets that generate a somewhat higher return than government bonds -- returns more in line with AA corporate bonds. Actual experience in plan closures where annuities are purchased through life insurance companies usually results in a net obligation that is larger than the accrued benefit obligation calculated under the Financial Accounting Standards Board rules that dictate the standards for public disclosure.
Asset Values in Pension Trusts Fall as Stock Markets Tumble
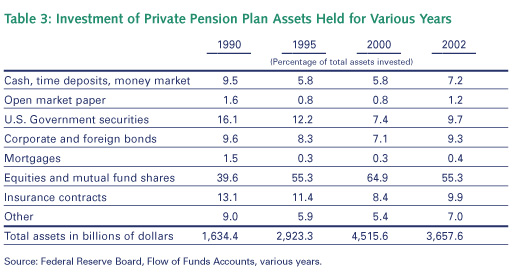
Poor stock market performance over the past three years has dealt a harsh blow to the value of assets in private pension plans. According to the Federal Reserve''''s Flow of Funds Accounts, from the end of 1995 to the end of 1999, the assets in private pensions climbed from $2.9 trillion to $4.6 trillion. By the end of 2002, they had declined to $3.7 trillion. Of the total decline in assets of $970 billion between 1999 and 2002, $840 billion was attributable to the declining value of corporate equities held in private pension trusts. Over the same period, mutual fund balances in private pension trusts over the period declined by another $220 billion.
Just as there are alternative methods for valuing liabilities in employer-sponsored pensions, there are also alternatives for valuing the assets behind them. Under ERISA, asset valuation must take into account fair market value. The method used in valuing assets must be consistently applied and must produce an actuarial value within a corridor of 80 to 120 percent of the assets'''' fair market value. Under current disclosure requirements, the value of assets can be either the fair market value or a smoothed value that "recognizes changes in fair value in a systematic and rational manner" over no more than five years. The rules allow alternative methods for determining the market-related value of different classes of assets as long as the valuation method is consistent over time for each asset class.
Growing Liabilities and Falling Asset Values Lead to Underfunding
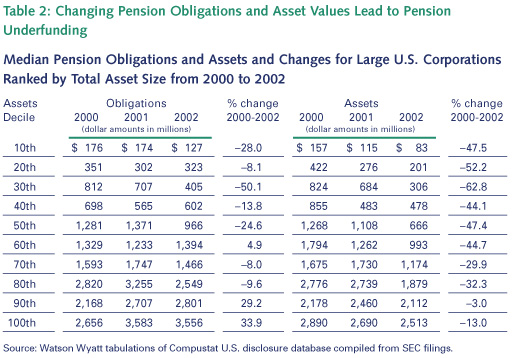
Table 2 pulls together the net effects of changing pension obligations and asset values on corporate plans. The table covers the same companies covered in Table 1, but reports median obligations and assets within the deciles, which are 10 percentile groupings of companies by their total corporate asset size. Table 2 suggests that the financial markets have affected plans somewhat differently across the company size spectrum. The smaller companies (note that this group is drawn from the largest 1,000 public corporations in the United States) appear to have reduced obligations fairly substantially, despite the falling discount rates and subsequent higher pension liabilities. Among larger plans, the story is somewhat mixed. But even where liabilities have been cut, the reductions typically have been less than at smaller companies. On the asset side, smaller firms appear to have lost more value in the stock market declines than larger ones.
Part of the explanation has to do with how plan sponsors have reacted to the events of the last three years. During the spring of 2003, Watson Wyatt surveyed slightly more than 500 current defined benefit plans to see how they were responding to current conditions. Of these, 15 percent have frozen or reduced benefits for current employees since the beginning of 2000 and 19 percent have done so for new hires. Smaller employers were more likely to have implemented benefit freezes. Larger employers were more likely to reduce future benefits by changing plan designs. Completely freezing the plan reduces costs more quickly than gradually reducing the accrual of future benefits.
The Real Pension Crisis and Potential Solutions
The publicity over the recent declines in pension funding along with the collapse of a number of large, significantly underfunded plans has prompted some people to conclude that the entire private defined benefit system needs significant shoring up. Where it exists, pension underfunding is a problem that deserves attention üEbut it is not the most serious problem facing the pension system today.
Evaluating Long-term Operations from a Short-term Perspective
Although freezing benefits threatens participants'''' long-term retirement security, it is only a vestige of the more serious threat to defined benefits in the current turmoil. The PBGC reports a decrease of more than 7,500 defined benefit plans over the past three years -- the demise of roughly 20 percent of these plans. Further, many close observers have become legitimately concerned about the retirement income security of participants in the remaining private defined benefit plans. Perceptions about what really ails the defined benefit system vary widely, however, and recommendations for a remedy are equally varied, sometimes even diametrically opposed.
Some in the pension plan sponsor community have voiced concerns that the 30-year Treasury bill rate is inappropriate for valuing pension liabilities. At least two arguments support this conclusion. First, the recent history of 30-year Treasury bond rates may not even represent the long-term rates the federal government actually faces in borrowing from the public. Second, almost all pension plan sponsors invest in assets that pay considerably higher rates of return than low-risk government securities.
From 1950 to 1997, the U.S. government ran five surpluses. In 1994 the deficits started trending down rapidly, and by 1998, the government was in surplus for the first time in 30 years. It ran surpluses in the next three years. Fed Chairman Greenspan said that the stock market was being driven by "irrational exuberance." Massive fortunes were made and massive distributions of stock profits generated unexpected, essentially windfall, government revenues. But once the money started to roll in, government budgeters joined the prognosticators predicting a 36,000 Dow Index, and both the Office of Management and Budget and the Congressional Budget Office were projecting surpluses "as far as the eye could see." In an environment of budget surpluses and plans to pay off the federal debt in a decade or so, falling long-term federal yields should hardly be a surprise.
That era seems like ancient history now. In recent months, reality has reasserted itself, and the present -- and projections for the future -- look more like most of the past. In 43 of the 50 years leading up to 2000, the U.S. government ran deficits. The recent period of government surpluses was an aberration. Once again, our government is spending considerably more than it is taking in. Furthermore, we are finally beginning to focus on the claims that the baby boom will soon make on Social Security and Medicare, and simultaneously reaching the conclusion that financing our nation''''s security in the 21st century may require more resources than we expended over much of the last quarter of the 20th century.
If earlier expectations of continuing surpluses drove down interest rates, the fiscal policy responses to the economic doldrums beginning in 2000 have exacerbated them. Today, however, some people seem to realize that long-term interest rates based on expectations of 1999 or 2000 may have been as irrationally exuberant as the dreams of a 36,000 Dow Index by 2005.
In addition to the rather unique situation that unfolded in regard to long-term U.S. Treasury rates during the 1990s and early 2000s, another element of valuing pension liabilities is how private pension assets are invested. Table 3 shows the extent to which private pensions in the United States invested in U.S. government bonds during 1990, 1995, 2000 and 2002 according to the Federal Reserve''''s Flow of Fund Accounts. Separate tabulations of the Form 5500 files compiled by the U.S. Department of Labor (DOL) for most of this period indicate that between two-thirds and three-quarters of the plans held less than 10 percent of their assets in Treasuries in any one year. When the 30-year Treasury rate was adopted as the basis for plan funding, the upper end of the range of rates used to value pension obligations was a rough approximation of the rates for long-term, high quality bonds.
While the recent, historically low 30-year Treasury rates may not persist, they have already played a significant role in the demise of many pension plans. During 1999, Fortune 1000 companies contributed $11 billion to their defined benefit plans. In 2000, their contributions jumped to $16 billion, and in 2001, $14 billion. In 2002, total contributions by these companies soared to $43.5 billion, representing about 180 percent of the estimated unfunded current liability in underfunded plans at that time (using the maximum current liability interest rate allowable, 6.85 percent). Despite the infusion of more cash into the plans in 2002 than had been contributed over the previous three years combined, plan funding continued to deteriorate. But worse may be yet to come.
Assuming that those Fortune 1000 plan sponsors with underfunded plans today reduce their contributions to only 100 percent of the estimated unfunded current liability using the maximum current liability interest rate for 2003, they will contribute $83 billion to their plans this year. Even assuming annual returns of 8 percent this year and next, these same employers would have to contribute nearly $80 billion for 2004. The recent growing costs of maintaining pensions undoubtedly have contributed to the demise of some of the plans that have been terminated or frozen over the past couple of years. But the recent history of plan curtailments will likely pale in comparison to future developments if the remaining plans have to face the cash call that current law portends. If these plans could use the current Salomon Brothers Pension Liability Index rates, which reflect corporate AA bond rates, the two-year contributions would drop to roughly $45 billion. Given the stark contrast in the prospects for cash claims, employer groups have been advocating a move away from the Treasury rate to the long-term AA corporate bond rate, and Representatives Rob Portman (R-Ohio) and Ben Cardin (D-Maryland) have proposed that solution as part of the Pension Preservation and Savings Expansion Act of 2003 (H.R.1776).
Many people in the employee benefits community believe this relief might provide greater long-term benefit security for participants in private pensions than meeting the current contribution requirements. But others are very concerned about the underfunding of benefits in general. This latter set of concerns has led to a number of alternative recommendations.
Bush Administration Proposals for Restoring Pension Stability
The Bush administration is cognizant of the fragility of the private pension system as plan sponsors face the prospect of ballooning contribution requirements at a time when many of them are financially strapped. The administration proposes substituting a four-year average corporate bond blend rate for valuing pension liabilities during 2004 and 2005 and maintaining the 90 to 105 percent corridor around that blended rate. At the same time, the Bush administration is concerned about the short-term implications of the cash call that pension plans would make on employers under current law.
The Bush administration is also seeking to avoid a repeat of what happened in the steel and airline industries, which have dumped massive unfunded liabilities on the PBGC over the past couple of years. In response to all these concerns, the administration proposes valuing liabilities using a term structure of interest rates that matches the term structure of the liabilities, granting the government stronger rights to take over plans and further limiting the ability of underfunded plans to enhance benefits for existing participants.
Concerns about the term structure of liabilities and the riskiness of the equity assets backing them have led other analysts to conclude that defined benefit plan sponsors should match plan liabilities with a bond portfolio of the same term structure. This concept has been around for some time but is attracting new interest today. While in the past, the regulatory structure has never limited plan investments beyond prudent man requirements and restrictions on owning a sponsor''''s own equity, current concerns could lead to proposals requiring pension sponsors to match assets more directly to liabilities than ever before.
Understanding Pension Underfunding in a Longer-term Context
Recent developments have shone a spotlight on a problem in pension funding, but the problem actually started many years ago. Those watching closely knew that pension funding ratios would become much more volatile than in the early period under ERISA. Some of the remedies now being proposed may reduce the volatility in future pension funding ratios -- if they work -- but they also have the potential to kill the patient.
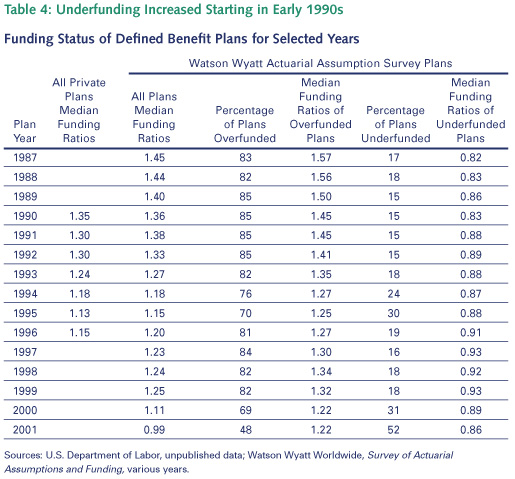
Table 4 shows the funding status of private sector defined benefit plans for selected years. The funding ratios are based on unpublished DOL tabulations of plan disclosure data. The Watson Wyatt Worldwide data are from annual surveys of a sample of plans with more than 1,000 active participants. These surveys gather information on the actuarial assumptions used in valuing pension plans and their funding status from various years. The DOL data are shown to confirm that the Watson Wyatt data fairly closely reflected the general state of plans in years when there was overlap. The Watson Wyatt data, however, are better for illuminating the roots of the pension funding problem because they cover a longer time period than the DOL data. The measure of funding status is the ratio of the level of assets in the plan against the actuarial accrued benefit or current liability. While this is not the equivalent of the plan''''s shutdown liability, it is a reasonable proxy for it.
The important aspect of Table 4 is that the pattern of reduced funding of pension obligations began in the early 1990s, well before current conditions began adversely affecting both pension liabilities and assets. The reason for the early deterioration in funding ties back to the evolution of the regulatory environment beginning in the 1980s and persisting into the 1990s. The first blow was struck by the Tax Equity and Fiscal Responsibility Act of 1982, when Congress started adopting a series of initiatives to restrict the level of pension funding allowed under the federal tax code.
A major cause of the current pension funding problem lies with the Omnibus Budget Reconciliation Act of 1987. OBRA87 changed the full funding limits on pensions by tying the limit to the current liability (the accrued benefit obligation in accounting terms) instead of the actuarial accrued benefit (the projected benefit obligation from the accounting perspective). This promoted the belief among employers that the appropriate funding target was not the accumulated obligation for an ongoing plan, but rather the plan''''s obligation in a shutdown situation.
The situation created by OBRA87 was exacerbated by a series of regulatory and legislative provisions adopted during the 1980s and 1990s that limited plan sponsors'''' ability to tap excess assets. In 1983, the IRS established guidelines regulating asset reversions in plan terminations. They required the purchase of annuities for all plan benefits to protect employees against market fluctuations and confirmed that employers could reestablish plans after a reversion. The Tax Reform Act of 1986 applied a 10 percent excise tax to the reversions. The excise tax later rose to 15 percent, and the Omnibus Budget Reconciliation Act of 1990 pushed it up as high as 50 percent, on top of corporate income taxes.2 This virtually ended the practice of terminating plans to access surplus funds, although the lower interest rates prevailing in much of the 1990s would have made such terminations less attractive anyway. While the flow of funds from tax-qualified plans for purposes other than providing retirement income to plan participants had been largely stanched, the new rules locked up employer contributions to their pension plans tighter than ever before.
With employers now focused on a funding standard based on current liability and unable to recoup excess pension assets, the practice of funding projected benefits under an ongoing plan began to wane. By 1993, the number of fully funded plans started to diminish for the first time since the passage of ERISA. This was partly the result of falling interest rates, but it was also part of a changing mindset among plan sponsors because of the clear signals embedded in pension regulations. Between 1993 and 1995, when the decline in interest rates was sharpest, thus driving up liabilities, annual contributions fell by more than 20 percent. The funding ratios went with them. By the mid-1990s, the percentage of plans that were fully funded dropped 15 percentage points in only three years.
The stock market boom of the mid- to late-1990s masked this evolving funding trend. Rates of return on pension assets were so robust during the last half of the 1990s that asset values grew rapidly, despite continued declines in pension contributions. Were it not for the changes to the regulatory structure during the late 1980s and early 1990s, it is quite likely that many pension plan sponsors would have continued funding their plans from the perspective of an ongoing rather than a termination basis. Had that occurred, these plans would be weathering today''''s turbulence much better.
We cannot relive the prosperous decade now gone. But lessons from the past can inform our deliberations on policies that might serve us better in the future. The major lesson of the past 15 years should be that the only pertinent obligation for a secure ongoing pension plan is the projected benefit obligation to plan participants valued on the basis of reasonable expected returns on assets. All other liability measures create unfunded liabilities that will have to be covered down the line, when current workers may no longer be available to contribute via their productivity.
In addition, a corridor of just 90 percent on the low side of whatever interest rate is used to value pension obligations gives employers very little room to build up enough assets in flush years to offset lean years. No one should confuse religious texts with pension regulations, but from time to time, one aspect of our lives can be instructive in others. The biblical story of Joseph and the seven years of plenty and seven years of famine could well have been the perfect analogy for the late 1990s and early 2000s and pension funding. Alas, we got Joseph''''s lesson backwards and now we are paying the price. We must learn from our experiences or we will be condemned to repeat them. In the future, we should allow pension sponsors to take advantage of upswings in the financial markets by allowing somewhat greater overfunding of their plans with the understanding that this could help to ameliorate the potential pension costs posed by the downturns in the investment cycle. In cases where plans become grossly overfunded, we should allow the sponsors to tap into the excess assets on a limited basis without paying punitive taxes for doing so.
Putting Underfunding of Pensions in Perspective
One issue that has escaped notice in the discussions about aligning pension assets more directly with pension obligations is the relative role that pensions play within the context of a company''''s total financial operations.
To a certain degree, a pension plan is a corporate asset. There is very rich labor economics literature on the features of pension plans that enhance worker productivity. The plan''''s liabilities may have a more predictable term structure than some corporate liabilities but be less predictable than others. One issue that merits attention in this discussion is understanding how the problem relates to company size.
Figure 3 shows the distribution of pension benefit obligations minus pension assets stated as a percentage of total plan assets at the end of 2002. In other words, this is the net unfunded pension obligation stated as a percentage of the plan sponsor''''s total assets. These are the same plans we analyzed in Table 1 and other tables throughout the paper. In this case, the plans are broken into deciles by total assets of the firm. The smallest 10 percent of firms in terms of total assets are in the first decile, and the largest are in the 10th decile. At each decile, there is a vertical line with four indicators and a point through which a solid line passes connecting the deciles. The bottom indicator point in each of the vertical lines is the 10th percentile in the distribution of firms within that particular decile of net pension obligation divided by the sponsoring firm''''s total assets. The second indicator is at the 30th percentile, the third is at the 70th and the top one is at the 90th percentile of the distribution. The solid line passes through the medians of each of the distributions.
Figure 3 shows that, at the median, the maximum of the ratio of unfunded pension obligation to total assets is 4 percent. At the 70th percentile, it is slightly higher than 6 percent in the 5th decile class of companies, but less than that for plans sponsored by all other sizes of companies. The unfunded pension obligations at these companies do not represent a particularly large obligation compared to their total assets.
People choose to invest in corporations because they believe the management will take judicious risks in managing assets so as to generate higher returns than bonds would deliver. If an employer''''s pension obligations represent a disproportionate claim against the firm''''s assets, then investors naturally would become concerned. But when the pension obligation is a relatively small part of a company''''s total operations, investors are not likely to want corporate management to invest pension assets in bonds. If investors want to buy bonds, they can do so directly. Are there risks associated with holding equities in pension trusts? Of course there are, just as there are risks in virtually everything a corporation does in the pursuit of its business goals. Figure 3 suggests that pensions were a relatively small part of the operations of most sponsors even at the end of the 2002 fiscal year, after the full-force effects of falling interest rates and falling asset prices had taken their toll.
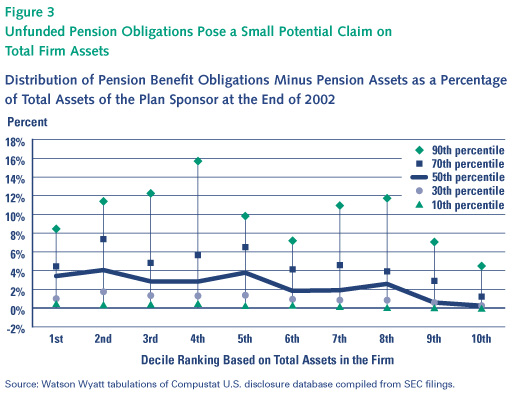
Figure 4 is similar to Figure 3, except the divisor in this case is the market value of equity in the firm. The scaling is different than in Figure 3, because the outliers at the 70th percentile show that net unfunded pension obligations are a much larger share of market value than of total assets in some of these firms. Indeed, at the 100th percentile, in most cases the ratio exceeds one and by many multiples in several of the deciles.
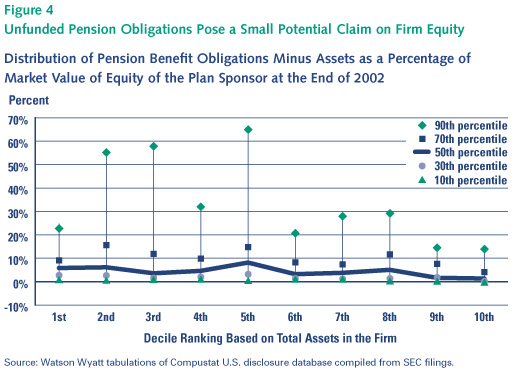
In some cases, unfunded pension obligations as a percentage of the firm''''s market value are large enough to merit concern. For most of the firms, however, unfunded pension obligations as a percentage of net worth does not exceed 20 or 25 percent. At the median, it is always less than 10 percent. This hardly suggests that most companies have taken on obligations that are wildly out of scope with the economic resources they have on hand to meet them.
Underfunding Is Still Manageable
One of the most remarkable aspects of Figures 3 and 4 is that hardly any of the plans are overfunded, and the few that are have hardly any assets in excess of their projected liabilities. The lowest points at each decile level in both of the figures represent the extent of funding relative to projected liabilities at the 10th percentile, so the 10 percent or so of plans that are overfunded at each size are not reflected. This means that the underfunding of private pensions was pervasive at the end of 2002, although it appears to be manageable in most cases. The reason for this latter conclusion ties back to the immediate history of private pension funding after the implementation of ERISA, as reflected in Figure 5. The point being that significant numbers of plans were underfunded at the time ERISA was implemented, but their sponsors steadily improved plan funding over the next few years.
The improving funding situation reflected in Figure 5 evolved in an environment where funding benefits was considered the best way to secure them. It was not until the 1980s, when the government''''s overwhelming fixation on minimizing tax losses led to the new funding limits, that the funding situation generally began to deteriorate. For many plans, the big problem with the new funding limits and other regulatory restrictions was that they could not build up a sufficient funding buffer during the prosperous times to weather the down times. For many plans, however, there are signs that the funding rules present a more significant structural problem.
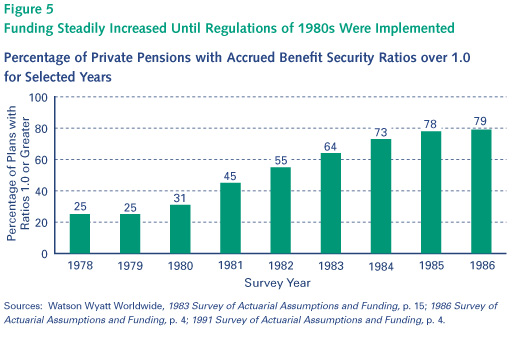
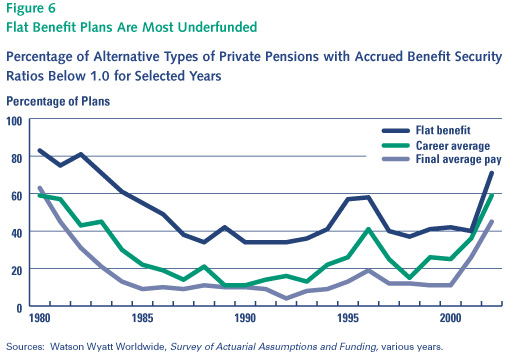
Figure 6 shows the percentage of different types of defined benefit plans whose accrued benefit security ratios were less than 1.0 from 1980 through the 2002 plan year. To the extent that pension regulations have either required or encouraged employers to operate their pensions on the razor''''s edge of being fully funded -- and no more -- in the best of times, they have made plan operations more volatile and riskier for both plan sponsors and participants. The implications of these policies are apparent in Figure 6 after 2000 for plans that base their benefits on final average pay. For other types of plans, however, there has always been more underfunding. That is because plans that base benefits on career average pay or a flat credit schedule tend to be updated relatively frequently, and the sponsors cannot anticipate the updates to fund the benefits provided under them. Chronic underfunding is particularly problematic for flat benefit plans. The lion''''s share of unfunded pension liabilities taken over by the PBGC have come from this type of plan. The fact that remaining plans have to shoulder the costs of PBGC payouts for underfunded plans further strains the ongoing plans, including those soundly funded by their own plan sponsors.
Diagnosis: Treat the Sick and Nourish the Healthy
Both sets of distributions in Figures 3 and 4 are based on conditions at the end of the fiscal 2002 year -- a point in time representing the worst macro-environment for pension plan funding for almost the entire period since the passage of ERISA. To the extent that there are problem outliers in these distributions, special funding and investment policies may be in order. But given the number of plan terminations over the past 15 years due to the onerous regulatory environment, now is not the time to saddle well-run plans with new rules to protect society from the relatively small number of chronically underfunded plans.
If we do saddle all plans with new rules really intended to deal with the troubled tail of the funding distribution, then the real pension crisis will be having dismantled a system that has served American business and workers well for nearly a century on false grounds. It is time to stop the general hyperbole about the trouble pension plans are in and find ways to make running them easier for prudent sponsors, and figure out how to move financially shaky plans onto sounder footing.
1The current rate is weighted at 40 percent in computing the average; the rate from the immediate prior year is weighted at 30 percent; the rate from two years ago is weighted at 20 percent; and the rate from three years ago is weighted at 10 percent.
2The excise tax is reduced to 20 percent under any one of the following three conditions: 1) bankruptcy, in which case the plan sponsor is under chapter 7 or Chapter 11 bankruptcy proceedings; 2) transfer to replacement plan, in which case the plan must cover at least 95 percent of the participants in the original plan; and 3) pro rata increase, in which case the employer provides a pro rata increase to participants of at least 20 percent of the reversion amount.
September 2003